Netzwerk

Centre-Line Network Model

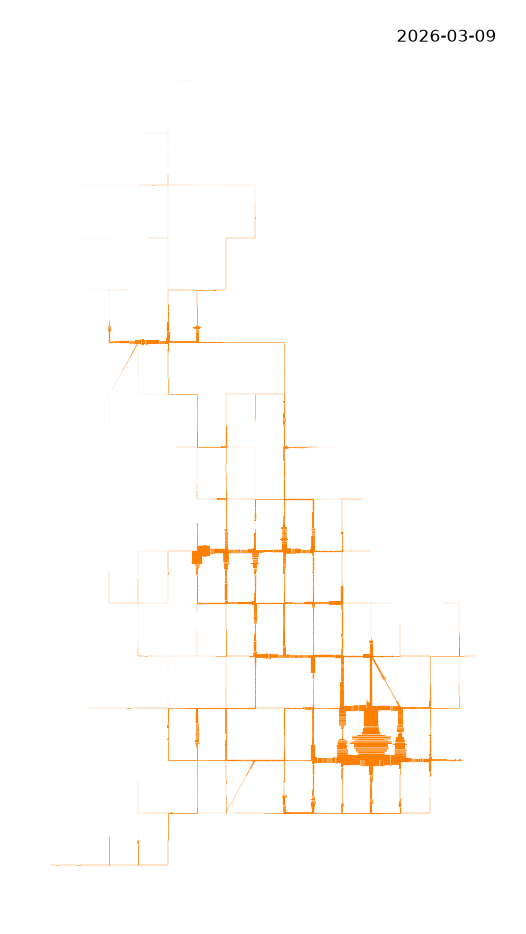
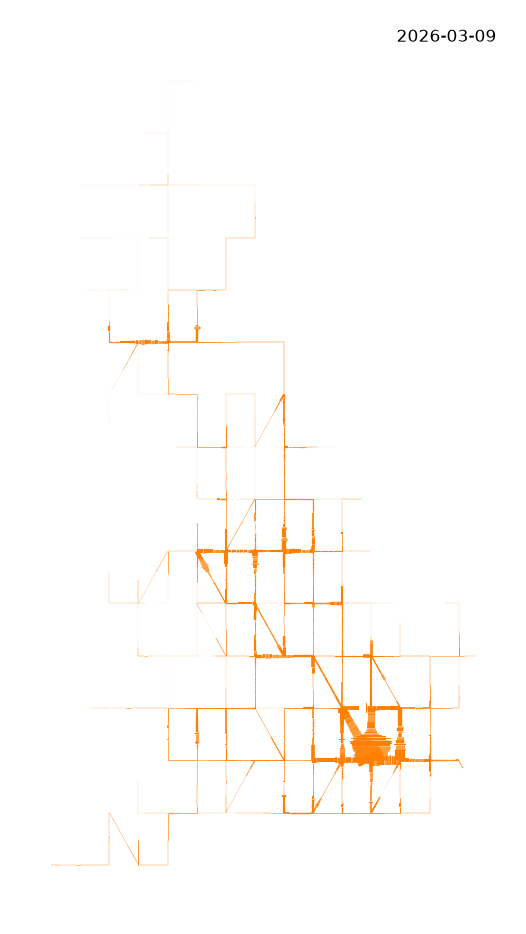
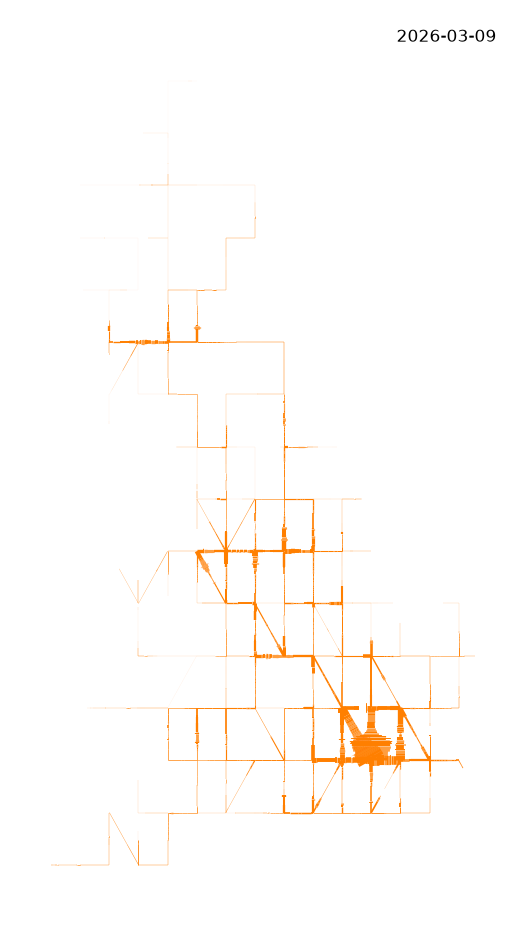
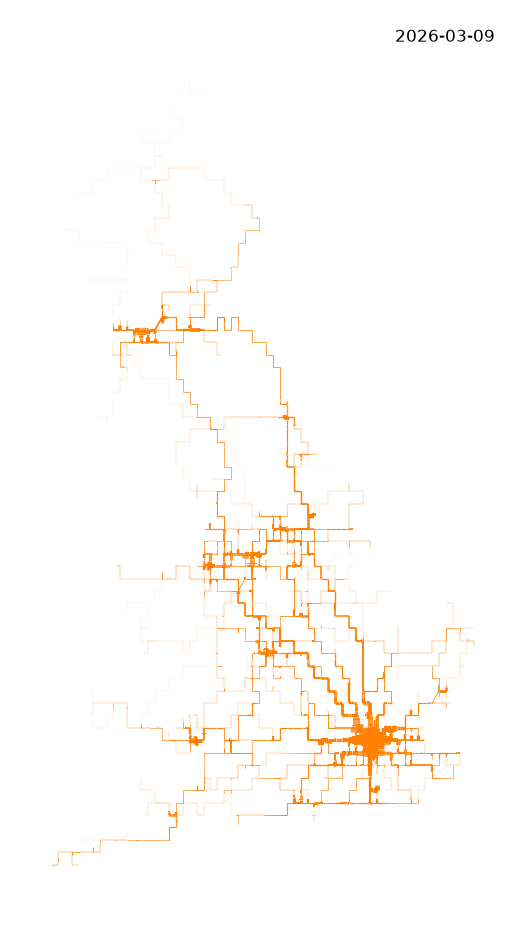
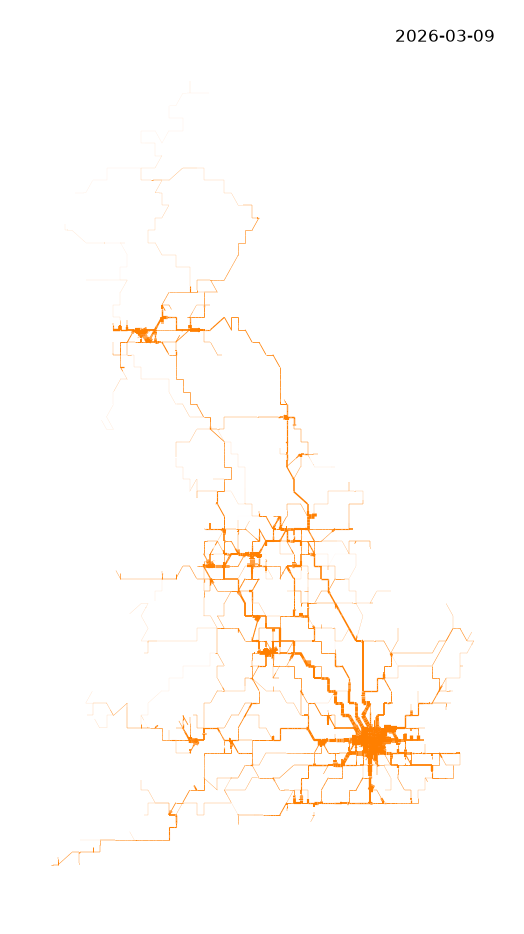
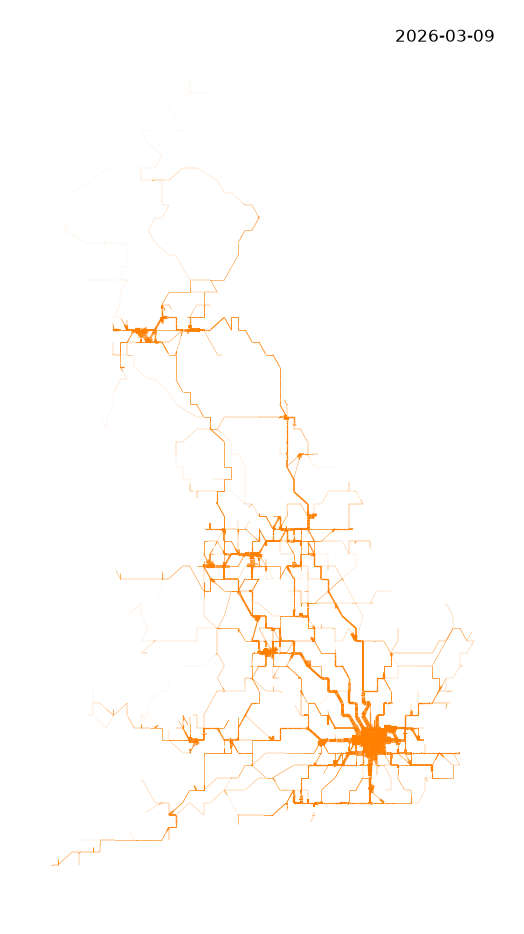
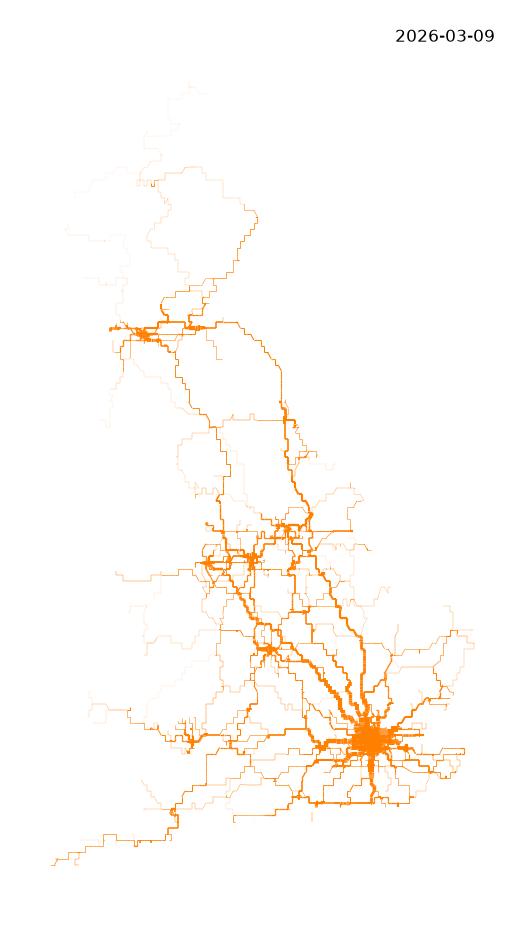
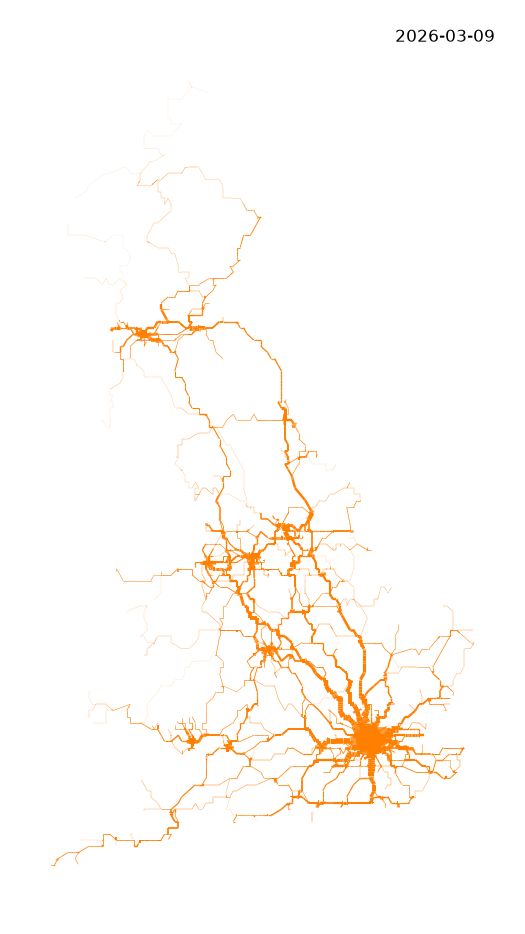
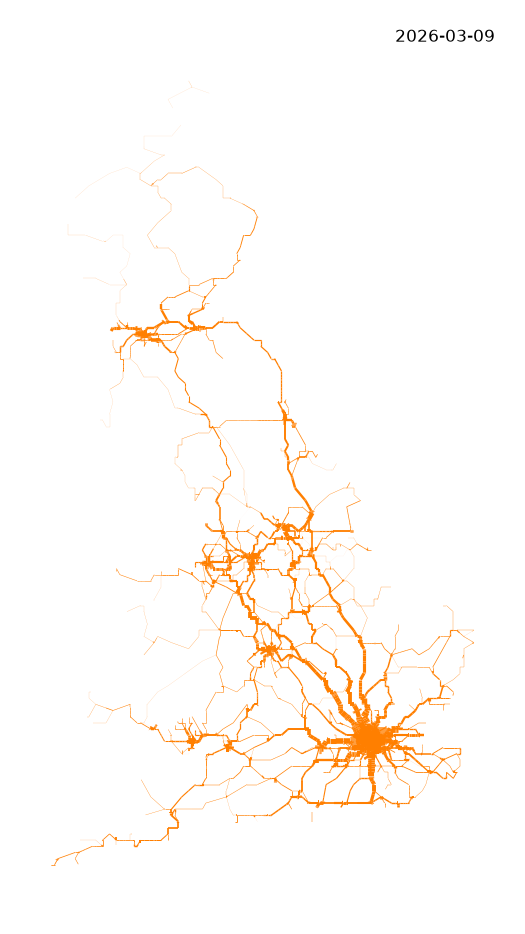
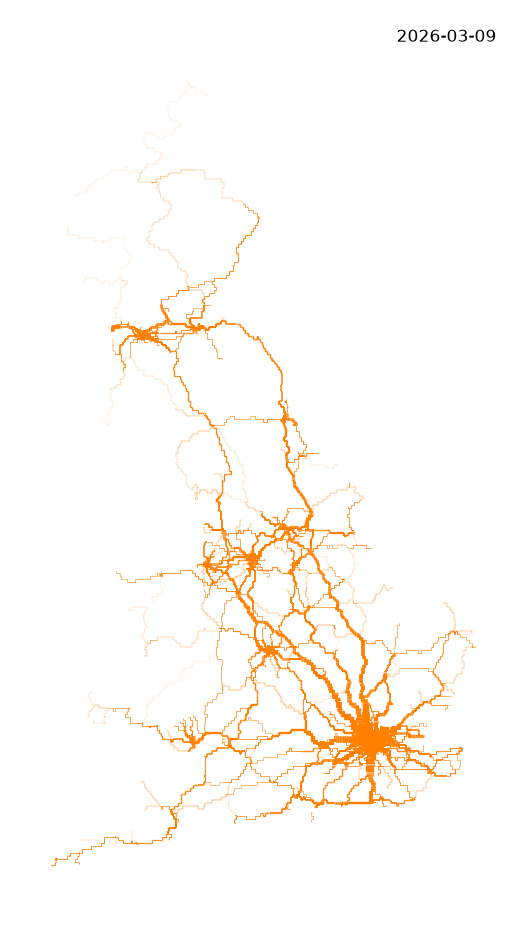
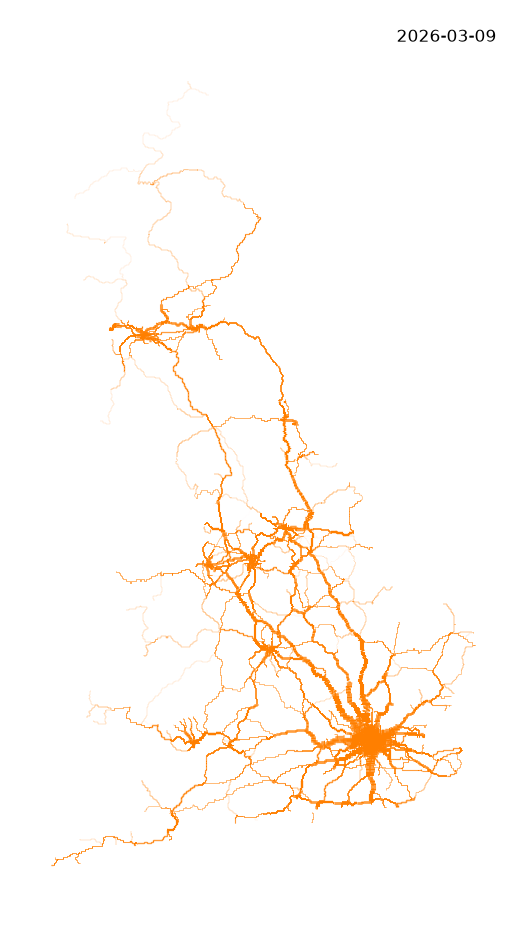
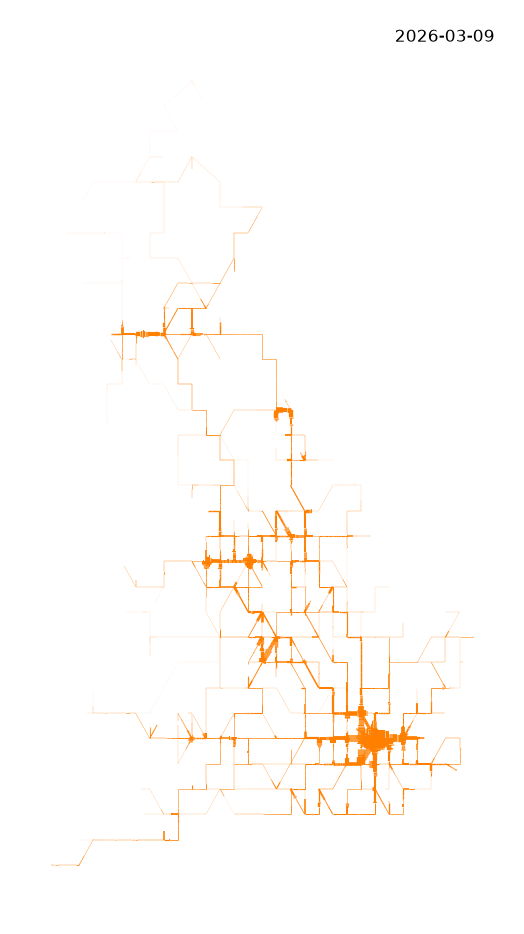
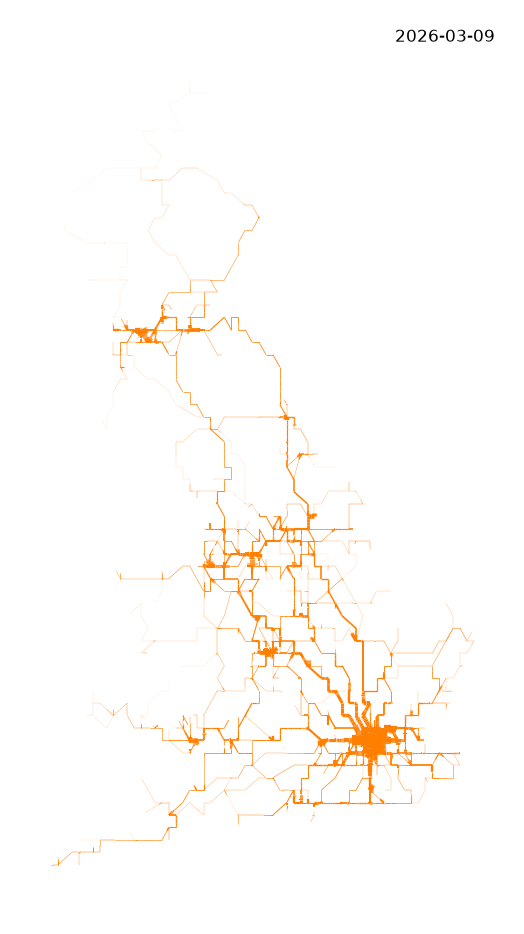
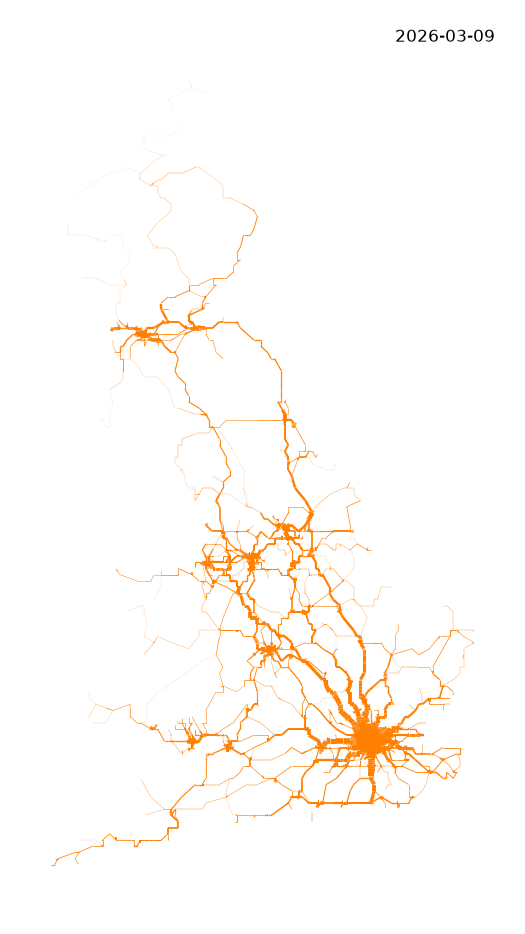
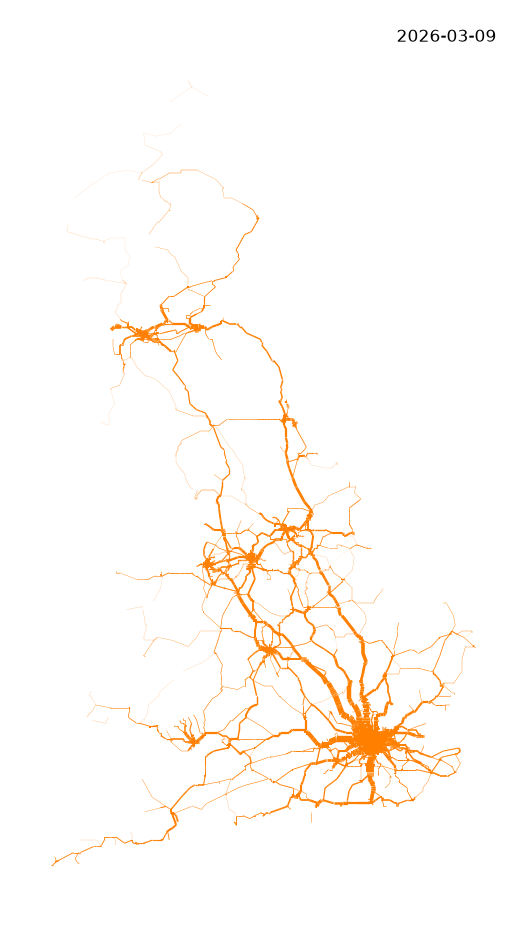
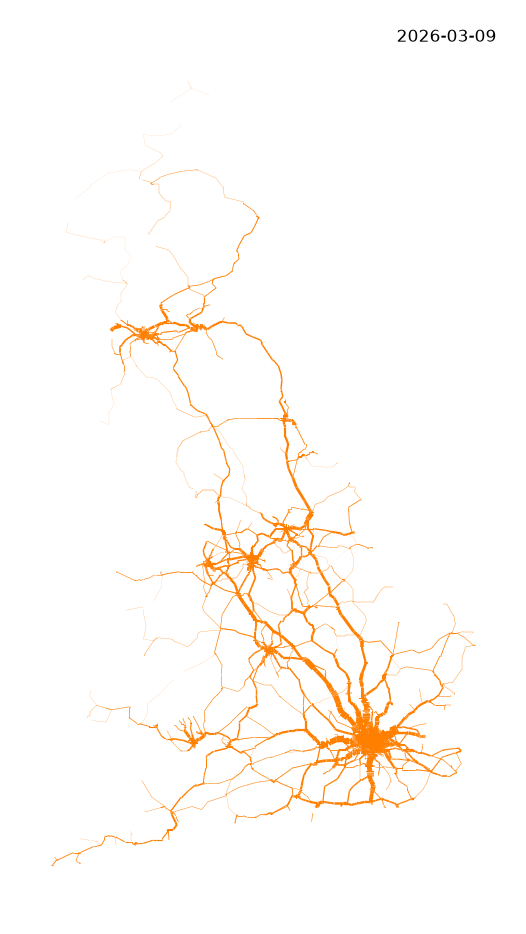
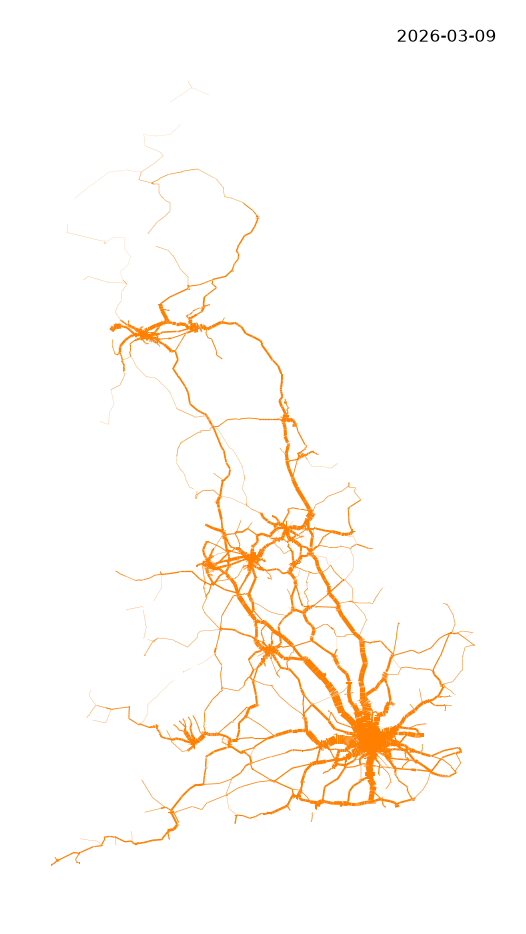
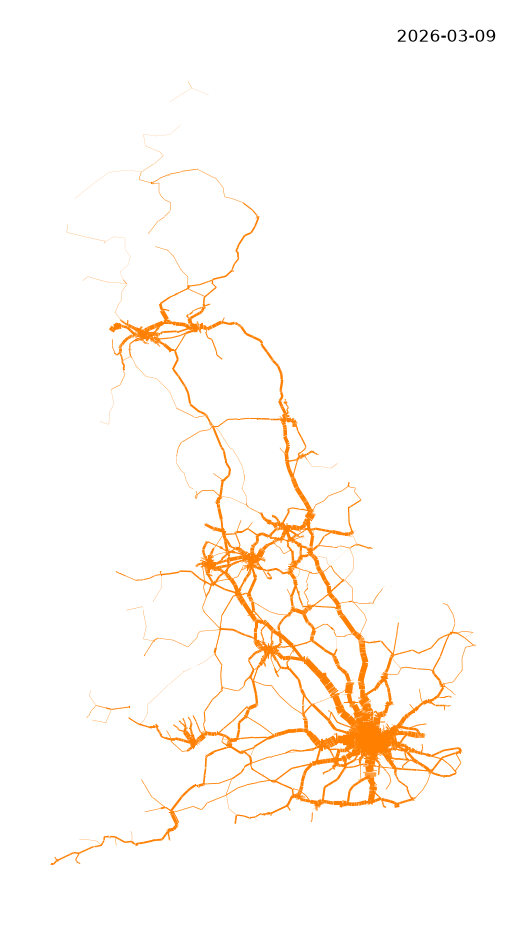
For those interested in such things, here is a visualization of timetabled passenger and freight movement on the #British heavy-rail network, aggregated over the week 2026-03-09 to 2026-03-15. This shows movement of train services based on TIPLOC to TIPLOC segments on maps with a series of TopoJSON simplification network simplification applied to a base map projected in OSGB36 (EPSG:27000), varying scale and quantization.

#rail #passenger #freight #data #visualization

Static

Aggregated heavy railway weekly services 2026 03 09 with varying TopoJSON simplification.

Network Model

No simplification or quantization.
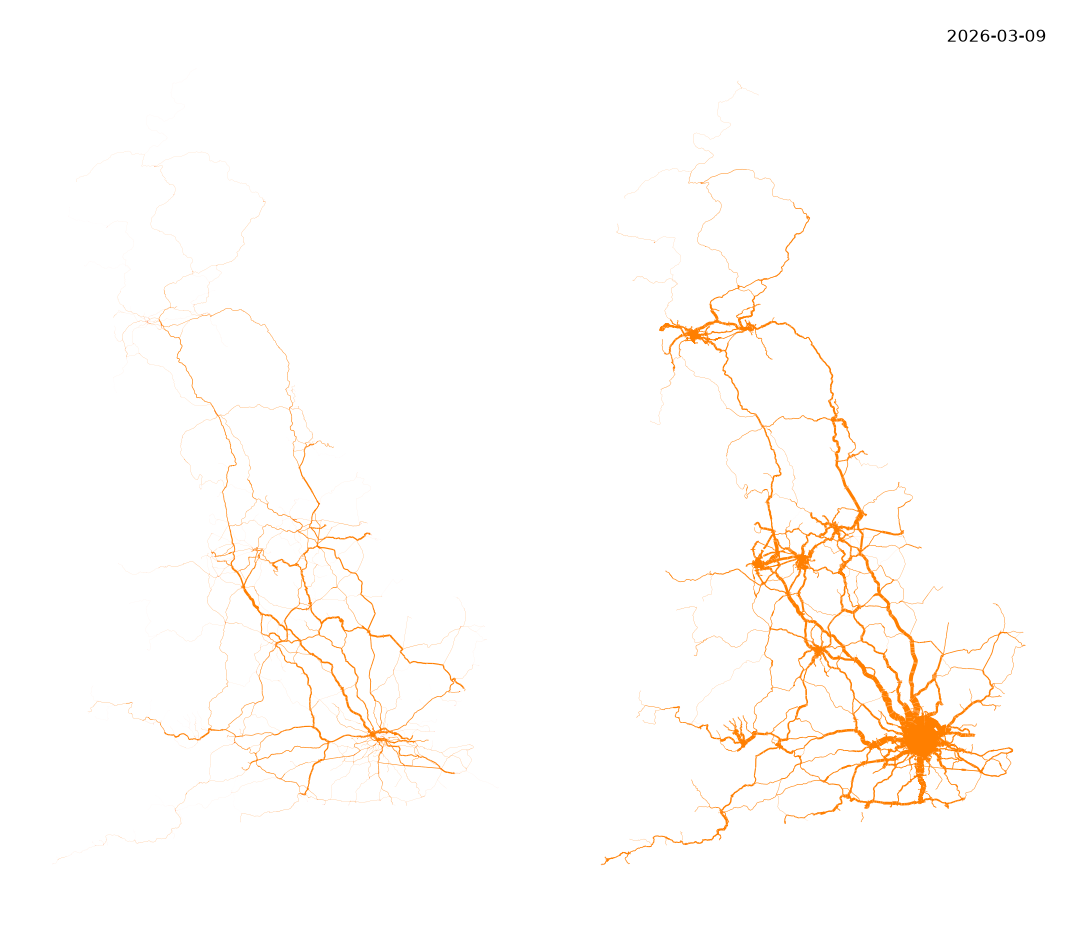
A map with orange lines representing heavy railway freight (left) and passenger services (right) with width proportional to the aggregated number of timetabled services that operated on week of 9 March 2026. Freight services (left) and Passenger services (right)

Topo Model quantize 16 vary scale
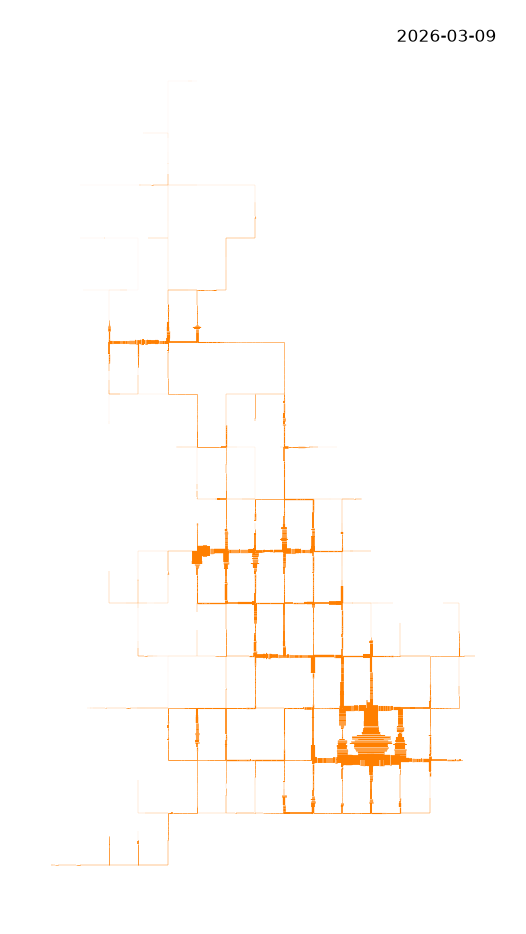
A map as orange lines with showing heavy railway freight (left) and passenger services (right) the width proportional to the aggregated number of services that operated on week of 9 March 2026. The line width is proportional to the number of timetabled services that operated.

Quantization 16 scale 0.01

A map with orange lines representing heavy railway freight (left) and passenger services (right) with width proportional to the aggregated number of timetabled services that operated on week of 9 March 2026.

Quantization 16 scale 10.0

A map with orange lines representing heavy railway freight (left) and passenger services (right) with width proportional to the aggregated number of timetabled services that operated on week of 9 March 2026.

Quantization 16 scale 1000.0

A map with orange lines representing heavy railway freight (left) and passenger services (right) with width proportional to the aggregated number of timetabled services that operated on week of 9 March 2026.

Quantization 16 scale 10.05

Topo Model quantize 64 vary scale
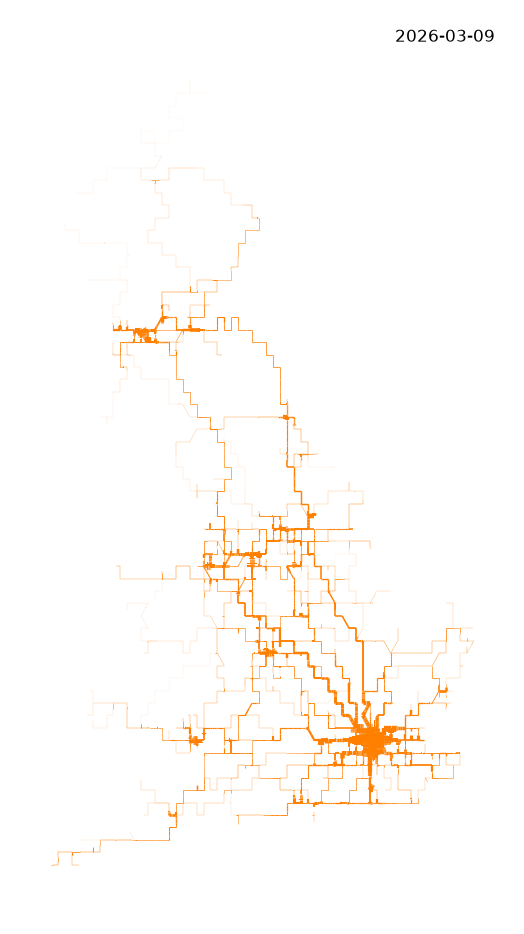
A map with orange lines representing heavy railway freight (left) and passenger services (right) with width proportional to the aggregated number of timetabled services that operated on week of 9 March 2026.

Quantization 64 scale 0.01

A map with orange lines representing heavy railway freight (left) and passenger services (right) with width proportional to the aggregated number of timetabled services that operated on week of 9 March 2026.

Quantization 64 scale 10.0

A map with orange lines representing heavy railway freight (left) and passenger services (right) with width proportional to the aggregated number of timetabled services that operated on week of 9 March 2026.

Quantization 64 scale 1000.0

A map with orange lines representing heavy railway freight (left) and passenger services (right) with width proportional to the aggregated number of timetabled services that operated on week of 9 March 2026.

Quantization 64 scale 10.05

Topo Model quantize 128 vary scale
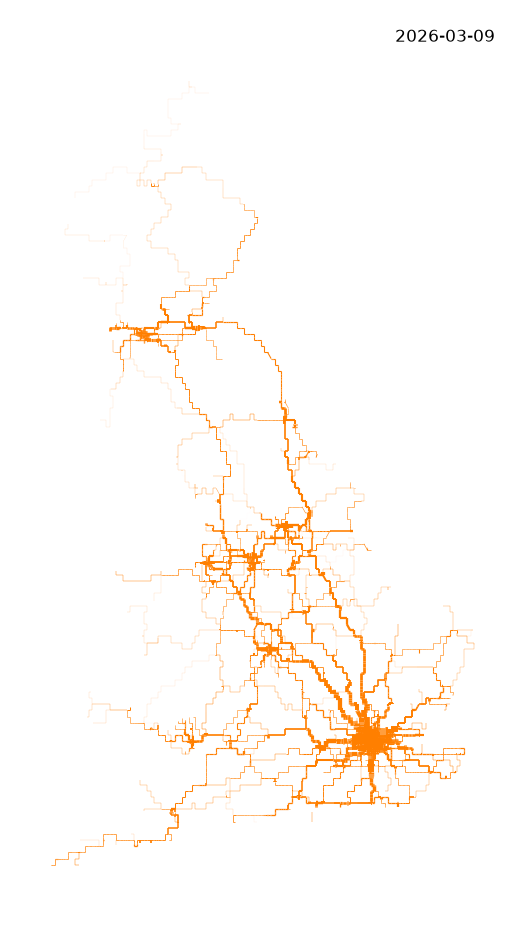
A map with orange lines representing heavy railway freight (left) and passenger services (right) with width proportional to the aggregated number of timetabled services that operated on week of 9 March 2026.

Quantization 128 scale 0.01

A map with orange lines representing heavy railway freight (left) and passenger services (right) with width proportional to the aggregated number of timetabled services that operated on week of 9 March 2026.

Quantization 128 scale 10.0

A map with orange lines representing heavy railway freight (left) and passenger services (right) with width proportional to the aggregated number of timetabled services that operated on week of 9 March 2026.

Quantization 128 scale 1000.0

A map with orange lines representing heavy railway freight (left) and passenger services (right) with width proportional to the aggregated number of timetabled services that operated on week of 9 March 2026.

Quantization 128 scale 10.05

Topo Model scale 1 vary quantization
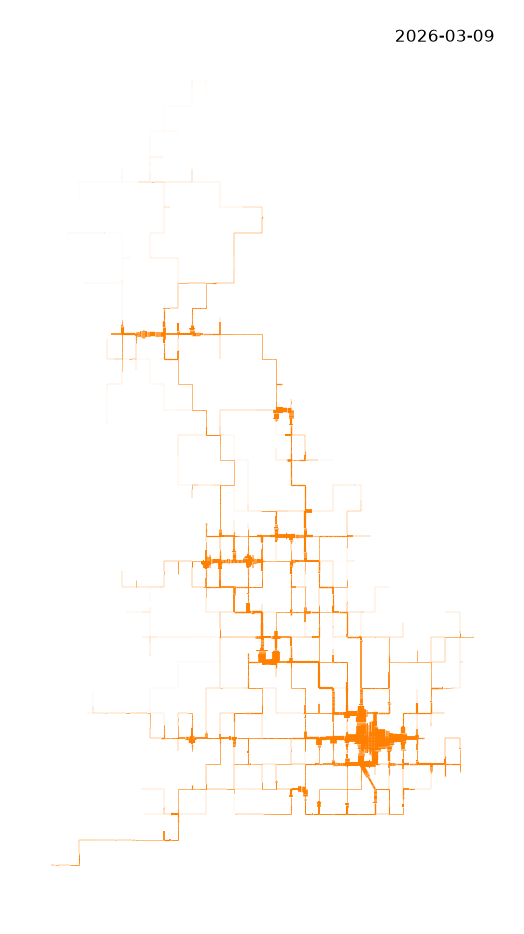
A map with orange lines representing heavy railway freight (left) and passenger services (right) with width proportional to the aggregated number of timetabled services that operated on week of 9 March 2026.

Quantization 16 scale 1.0

A map with orange lines representing heavy railway freight (left) and passenger services (right) with width proportional to the aggregated number of timetabled services that operated on week of 9 March 2026.

Quantization 32 scale 1.0

A map with orange lines representing heavy railway freight (left) and passenger services (right) with width proportional to the aggregated number of timetabled services that operated on week of 9 March 2026.

Quantization 64 scale 1.0

A map with orange lines representing heavy railway freight (left) and passenger services (right) with width proportional to the aggregated number of timetabled services that operated on week of 9 March 2026.

Quantization 128 scale 1.0

A map with orange lines representing heavy railway freight (left) and passenger services (right) with width proportional to the aggregated number of timetabled services that operated on week of 9 March 2026.

Quantization 256 scale 1.0

A map with orange lines representing heavy railway freight (left) and passenger services (right) with width proportional to the aggregated number of timetabled services that operated on week of 9 March 2026.

Quantization 512 scale 1.0

Topo Model scale 107 vary quantization
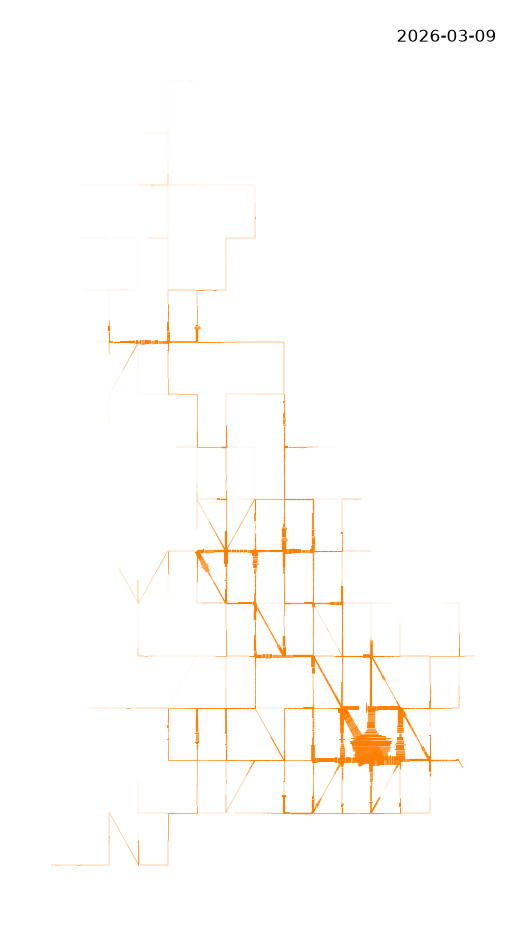
A map with orange lines representing heavy railway freight (left) and passenger services (right) with width proportional to the aggregated number of timetabled services that operated on week of 9 March 2026.

Quantization 16 scale 107

A map with orange lines representing heavy railway freight (left) and passenger services (right) with width proportional to the aggregated number of timetabled services that operated on week of 9 March 2026.

Quantization 32 scale 107

A map with orange lines representing heavy railway freight (left) and passenger services (right) with width proportional to the aggregated number of timetabled services that operated on week of 9 March 2026.

Quantization 64 scale 107

A map with orange lines representing heavy railway freight (left) and passenger services (right) with width proportional to the aggregated number of timetabled services that operated on week of 9 March 2026.

Quantization 128 scale 107

A map with orange lines representing heavy railway freight (left) and passenger services (right) with width proportional to the aggregated number of timetabled services that operated on week of 9 March 2026.

Quantization 256 scale 107

A map with orange lines representing heavy railway freight (left) and passenger services (right) with width proportional to the aggregated number of timetabled services that operated on week of 9 March 2026.

Quantization 512 scale 107

A map with orange lines representing heavy railway freight (left) and passenger services (right) with width proportional to the aggregated number of timetabled services that operated on week of 9 March 2026.

Quantization 1024 scale 107

A map with orange lines representing heavy railway freight (left) and passenger services (right) with width proportional to the aggregated number of timetabled services that operated on week of 9 March 2026.

Quantization 2048 scale 10.07

Reference and License

This is published under CC BY 4.0 Attribution and details about the licenses and open data used.